I’ve been learning a lot more about DevOps lately and decided to pick up a book called Prometheus: Up & Running to learn the ins and outs of Prometheus. I read through it and wanted to give my recent journey with Prometheus, how I set it up to monitor my personal network, and even wrote my own textfile collector and exporter. I used these metrics to create some basic Grafana graphs but most importantly, some alerts to my slack channel for issues with my servers and network.
Setup
While reading the book, I set up a local instance of Prometheus on my main server. I pulled in some metrics from my unifi network with unpoller and metrics about my servers with node-exporter. I also added Pi-hole exporter and blackbox to poll some of the websites I manage to make sure they are up. Here are a few of the alerts that I have setup:
- alert: High Memory Usage
  expr: 100 * (1 - (node_memory_MemAvailable_bytes / node_memory_MemTotal_bytes)) > 90
  for: 5m
  labels:
    severity: critical
  annotations:
    summary: High Memory Usage on {{ $labels.instance }} - {{ $labels.job }} = {{ $value }}%
    description: "Memory usage is above 90% (current value: {{ $value }}%)"

- alert: Server Down
  expr: up == 0
  for: 5m
  labels:
    severity: critical
  annotations:
    summary: "Node Exporter down (instance {{ $labels.instance }}  - {{ $labels.job }})"
    description: "Node Exporter has been down for more than 5 minutes."
These rules are piped through a slack notification config I have setup and works perfectly. I was excited to see what else I could monitor.
Creating My Own Exporter
One of the highlights of my learning journey was creating my own exporter called rsync-exporter. I use Rsync to sync all my docker volumes to an offsite server but never really had a way to make sure the Rsync was successful. With my new exporter, I am able to track when the last successful Rsync was along with how much data is being transferred and use that to make an alert when Rsync isn’t working properly. You can find more details about that in the repository.
Writing a Custom Collector for SnapRAID
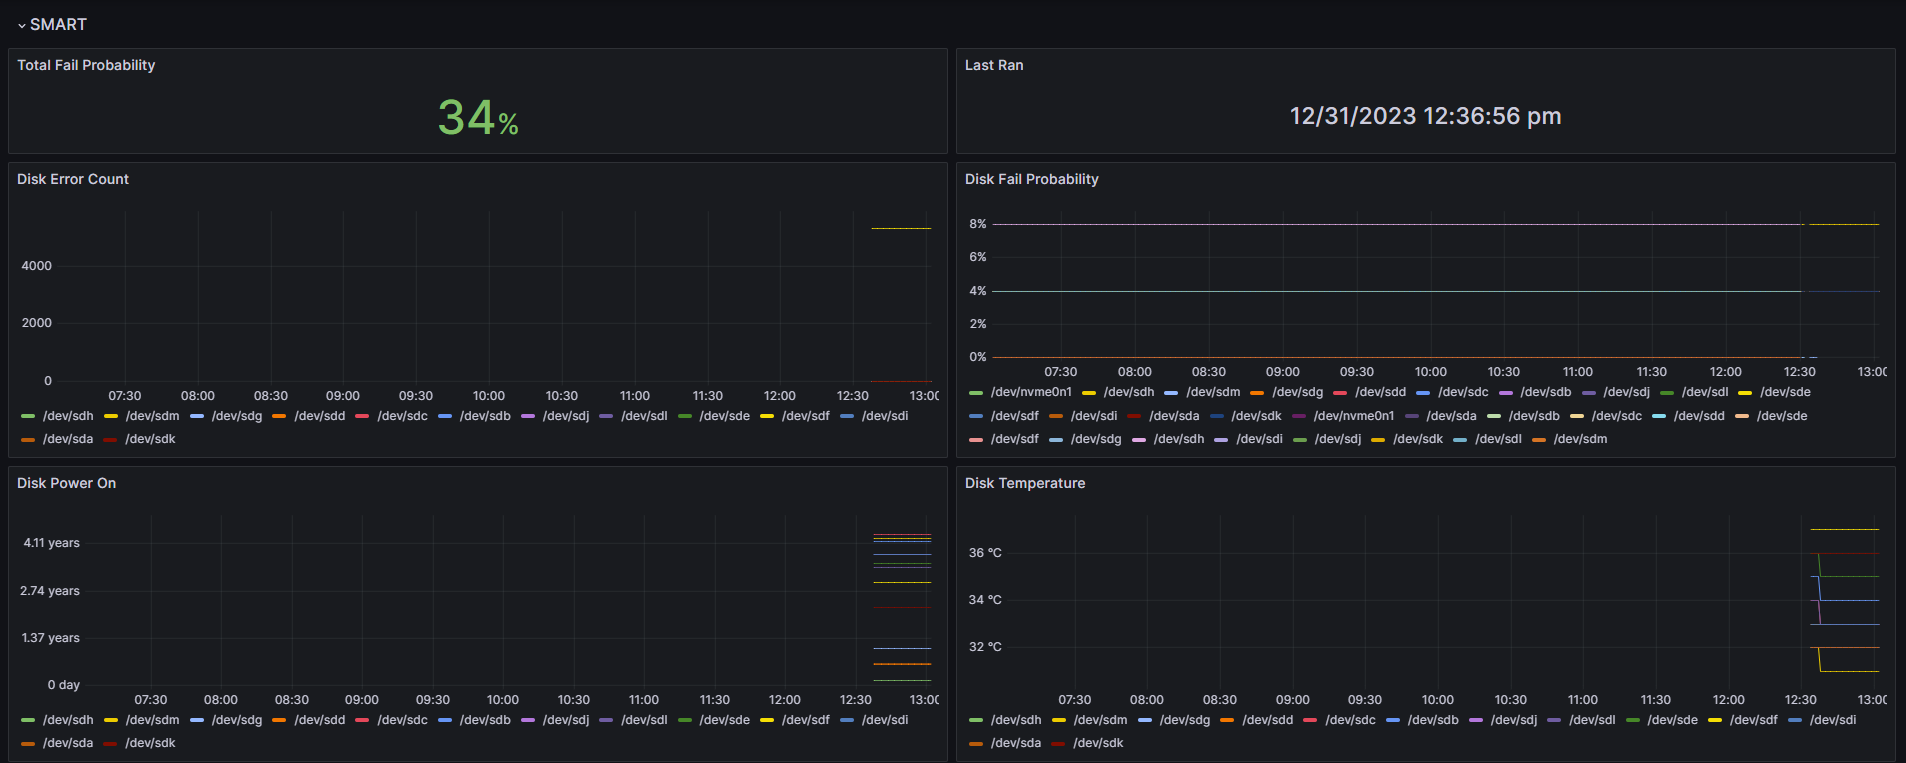
Additionally, I wrote a custom collector script for SnapRAID. I use SnapRAID to create a local backup of my servers and wanted to also work with the textfile collector feature of node exporter. That project lives here if you want to see more details but the overall structure is to parse metrics about the sync, scrub, and smart commands. I can then run my textfile script through a cronjob to generate prom files and make alerts about any issues with my hard drives and backups.
Conclusion
Overall my experience with Prometheus has been incredibly rewarding. I’ve not only learned to monitor my network effectively but also developed skills in creating my own collectors and exporters. Reading Prometheus: Up & Running and getting a real world setup going on my own network really gave me an indepth knowledge of how Prometheus works and is one more tool in my DevOps skillset I can use.